
When a Custom Fishbowl Report Is the Right Solution
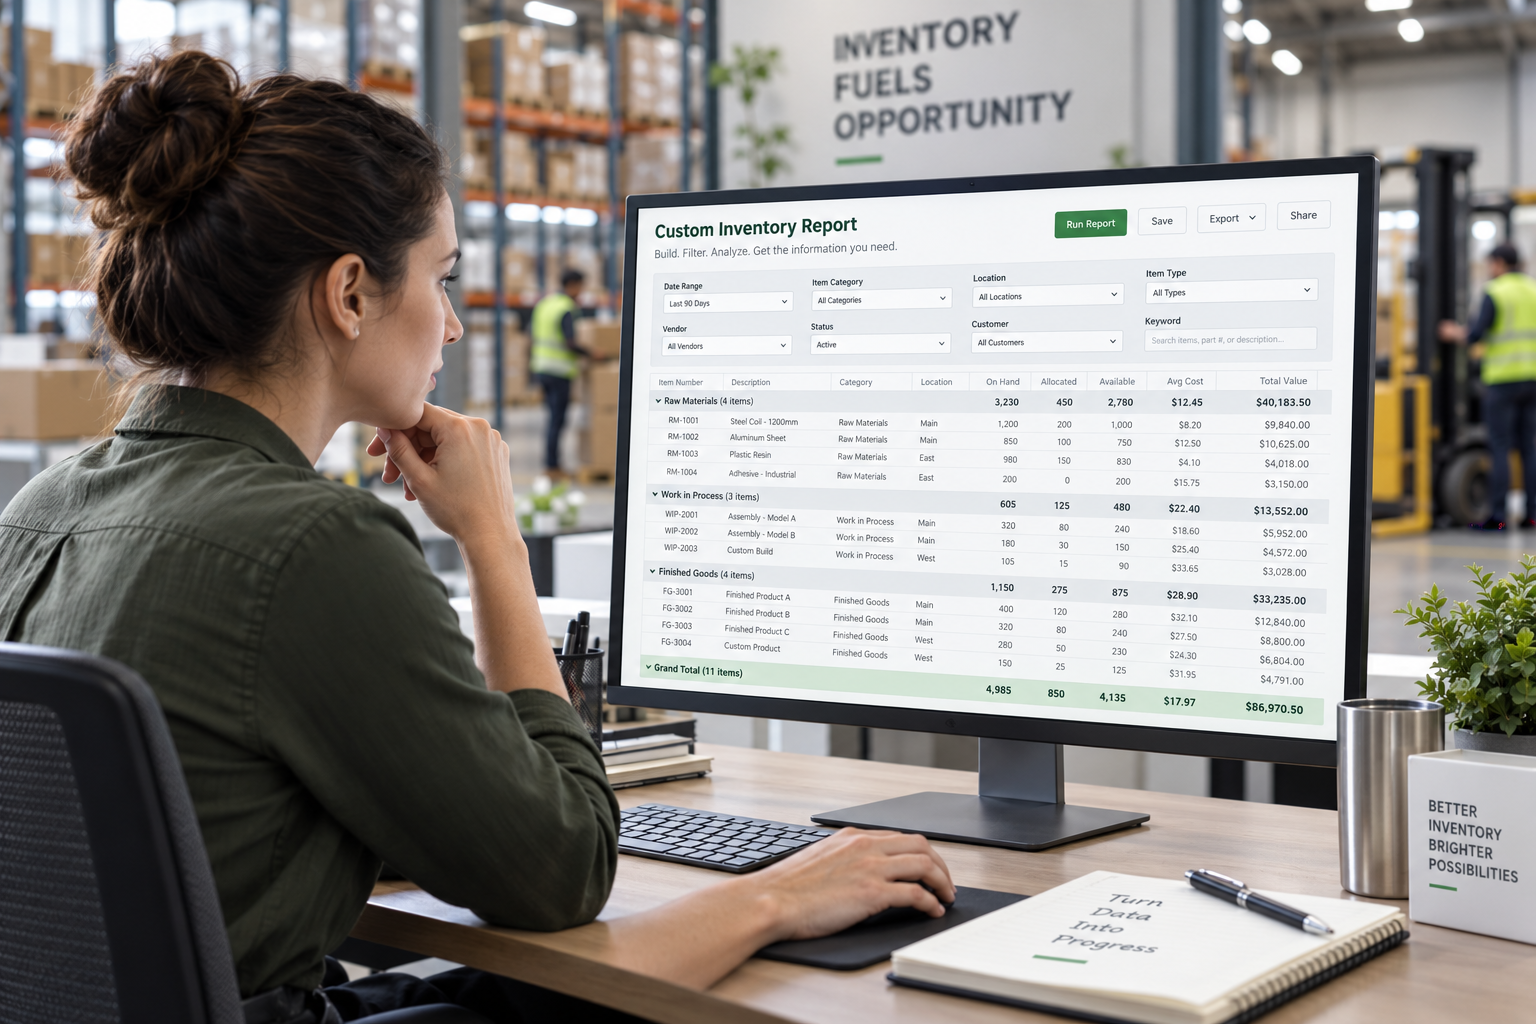
When Standard Reports Are Almost Enough
Fishbowl includes many useful standard reports, and in plenty of situations they do exactly what a business needs.
The problem usually arises when a standard report gets close but leaves out something important.
Maybe the report needs a different date, status, class, location, custom field, cost value, customer detail, or transaction relationship. Or perhaps the information exists in Fishbowl, but not in one report.
In those cases, replacing the entire workflow or exporting everything to a spreadsheet may be unnecessary. A custom report can often solve the problem more directly.
Signs a Custom Fishbowl Report May Be the Right Choice
A custom report is usually worth considering when the information needs to be used repeatedly.
Common examples include:
the same spreadsheet is rebuilt every week or month
users manually combine data from multiple Fishbowl reports
a standard report is missing one or two important fields
management needs a consistent operational view
users need different filters or calculations
custom fields need to appear alongside standard Fishbowl data
a report needs to combine related sales, purchasing, receiving, inventory, or manufacturing information
The key is repetition. If people are solving the same reporting problem over and over, it is often better to build the answer into a reusable report.
What a Custom Report Can Change
A useful custom report can do more than change the appearance of an existing report.
Depending on the requirement, it may:
Add fields
Include information that is not present in the standard report.Combine related data
Bring together information from sales orders, purchase orders, receiving, inventory, work orders, customers, products, or other related records.Apply better filters
Filter by dates, statuses, classes, locations, users, custom fields, products, customers, or other business-specific criteria.Perform calculations
Create totals, variances, margins, quantities, costs, or other measures the business actually uses.Reorganize the output
Present the information in a sequence or grouping that matches how users work.The goal is not to create a more complicated report. It is to remove unnecessary manual work and make the information easier to use.
Examples of Custom Fishbowl Reporting Needs
Custom reporting can be useful for questions such as:
What was received, when, and at what cost?
When was each part last purchased?
Which work orders were completed during a selected period?
What finished goods were produced from those work orders?
Which sales orders remain open and what still needs to be fulfilled?
How much inventory activity occurred for a particular part?
Which customers, products, or classes generated specific sales activity?
Which transactions contributed to an unexpected inventory quantity or cost?
These are not necessarily unusual questions. They simply may not match the exact structure of a standard Fishbowl report.
When SQL May Be Better Than a Custom Report
Not every reporting request needs a formal report.
If the goal is to answer a one-time question, investigate a discrepancy, or retrieve a very specific dataset, a SQL query may be faster and more appropriate.
SQL is especially useful when the information needs to be examined directly, combined across several tables, or tested before deciding whether a permanent report is worth building.
A good approach is often to solve the business question first and then decide whether the result should become a reusable report.
When a Dashboard May Be Better
A custom report works well when users need detailed information they can review, filter, print, or export.
A dashboard is usually a better fit when management needs to monitor the same KPIs repeatedly.
For example, a dashboard might show:
open sales orders
picking and shipping workload
purchasing activity
receiving activity
inventory levels
manufacturing status
fulfillment performance
other operational metrics
The distinction is less about the technology and more about how the information will be used.
Don’t Customize a Report Just Because You Can
Custom reporting is most useful when it solves a defined business problem.
Before building anything, it helps to ask:
What question are we trying to answer?
Who will use the report?
How often will they use it?
Which fields actually matter?
What decisions will the report support?
Is a report really the best format?
This prevents a custom report from becoming another large dataset that nobody actually uses.
A Good Custom Report Should Reduce Work
The best test is simple:
Does the report make it easier for someone to do their job or make a decision?
If users still need to export it, rearrange columns, combine it with another spreadsheet, and perform the same calculations every time, the reporting problem probably has not been fully solved.
A good custom report should move the user closer to the answer—not simply expose more data.
Need a Custom Fishbowl Report?
If Fishbowl contains the information you need but the standard reports do not present it in a useful way, Financial Fitness can help determine whether a custom report, SQL query, or dashboard is the best solution.