
Getting Better Reporting From Fishbowl Inventory
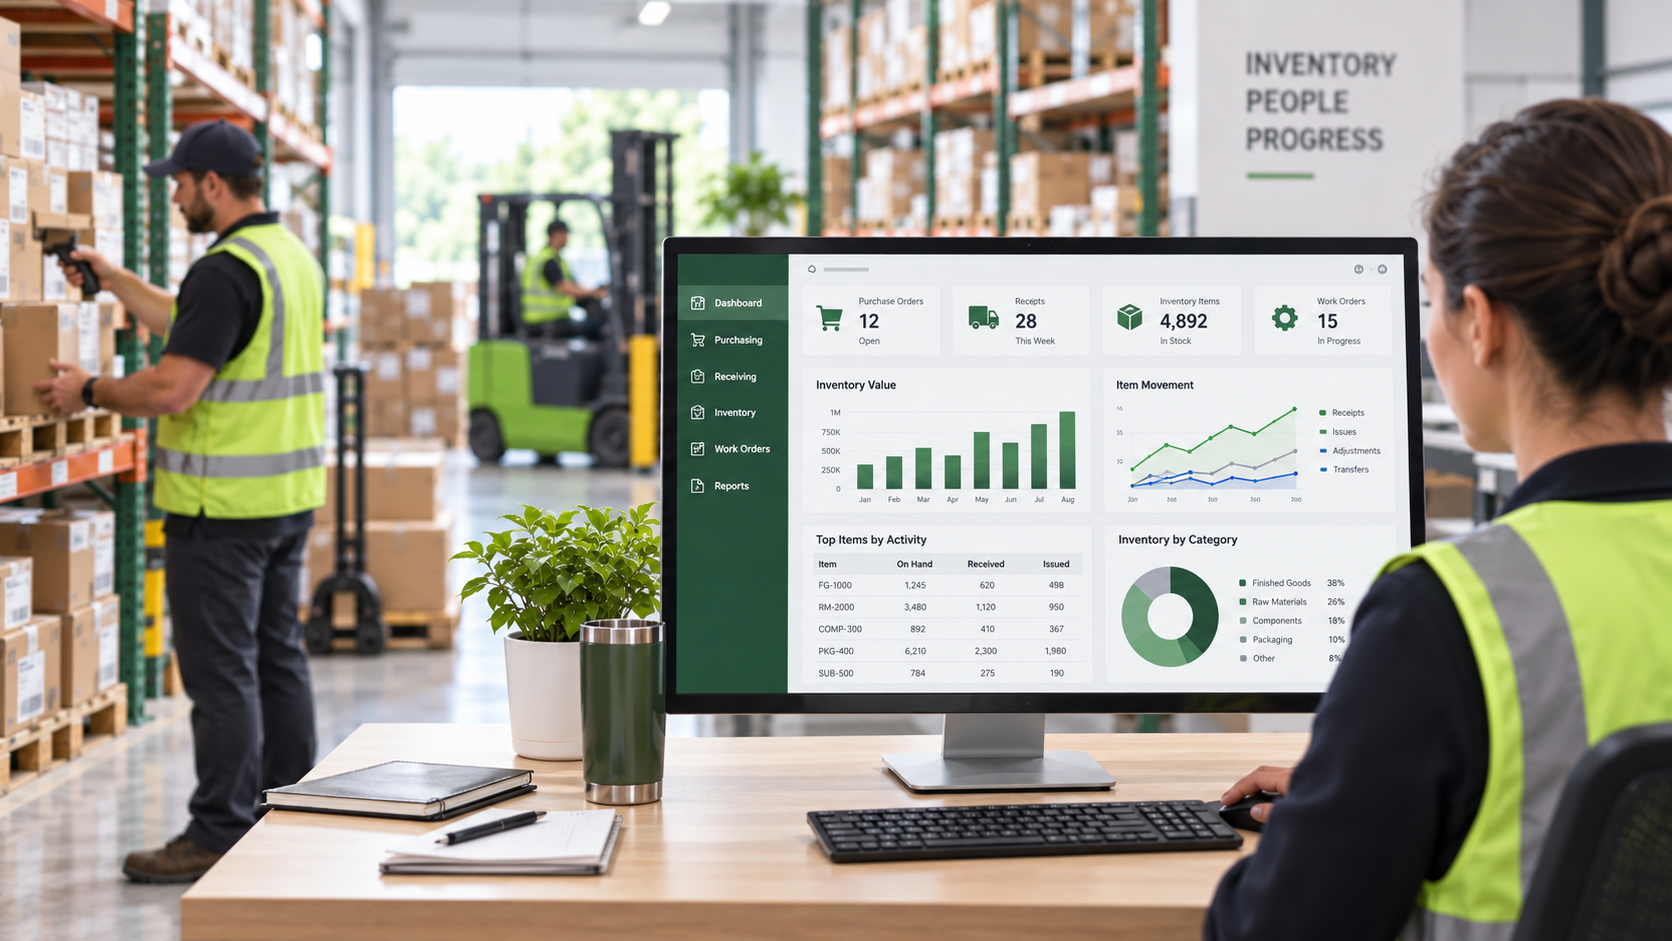
Fishbowl Inventory contains a tremendous amount of useful operational data. The challenge is that the information a business needs is not always available in the exact format provided by a standard report.
A manager may want to know which parts were purchased most recently, what was actually received during a particular period, which work orders were completed, how inventory changed, or what sales and fulfillment activity needs attention today.
In many cases, the data already exists in Fishbowl. The real question is how to turn that data into information people can actually use.
Why Standard Fishbowl Reports Aren’t Always Enough
Standard Fishbowl reports are useful when the question being asked matches the report that already exists. Problems arise when the business needs different fields, filters, calculations, relationships, or levels of detail.
For example, a standard report might contain most of the information you need but leave out a custom field, class, status, cost value, receiving date, or related transaction. In other situations, the information may exist across several different parts of Fishbowl and needs to be brought together into one view.
That does not necessarily mean the underlying data is missing. It may simply require a different reporting approach.
Start With the Business Question
Good reporting starts with what someone is trying to learn or decide—not with the database.
Before building a report, it helps to define the question as specifically as possible. Examples might include:
When was each part last purchased?
What purchase orders were actually received during this period?
Which work orders were completed, and what finished goods did they produce?
Which open sales orders still require picking or fulfillment?
How has inventory quantity changed over time?
Which transactions caused an unexpected inventory or costing result?
Once the question is clear, it becomes much easier to determine which Fishbowl data is needed and what type of reporting solution makes sense.
When a Custom Fishbowl Report Makes Sense
A custom report is often the right choice when users need a familiar, repeatable report inside their normal Fishbowl workflow but the standard version does not contain everything they need.
A custom report may add or reorganize fields, apply business-specific filters, combine related information, or present the results in a format that is easier for the team to use consistently.
When SQL Is the Better Solution
Sometimes the requirement is less about modifying an existing report and more about answering a very specific question. This is where a SQL query can be particularly useful.
SQL can retrieve information from related Fishbowl tables, apply filters and calculations, and produce datasets that standard reports cannot easily provide. It can also be useful for troubleshooting because the underlying records can be examined directly rather than only through a predefined report.
SQL is especially valuable when the question involves sales orders, purchasing, receiving, inventory activity, work orders, BOMs, customers, products, custom fields, or several of these areas at the same time.
When a Dashboard Is Useful
A dashboard becomes valuable when the information needs to be monitored repeatedly rather than researched once.
Management may want visibility into open sales orders, picking, shipping, purchasing, manufacturing, inventory levels, workload, fulfillment performance, or other operational KPIs. Instead of repeatedly exporting data to spreadsheets, a dashboard can organize those metrics into a consistent management view.
The important part is not the dashboard itself. It is choosing measures that help the business decide what needs attention.
Choosing the Right Reporting Approach
Standard Fishbowl Report — Best when an existing report already answers the question.
Custom Fishbowl Report — Best when a repeatable Fishbowl report needs different fields, filters, calculations, or formatting.
SQL Query — Best when the business needs a focused answer or information combined from multiple areas of Fishbowl.
BI Dashboard — Best when management needs recurring visibility into KPIs, workload, trends, or operational activity.
Need Better Reporting From Fishbowl?
If the information you need exists in Fishbowl but the standard reports are not giving you the answer, a custom report, SQL query, or dashboard may be a simpler solution than changing your entire workflow.
Financial Fitness helps manufacturers, distributors, and other inventory-driven businesses turn Fishbowl data into reporting that is actually useful.